Dashboard#
The dashboard is the main page of the DUMB Frontend, providing an at-a-glance view of all your services with real-time status updates and quick controls.
Overview#
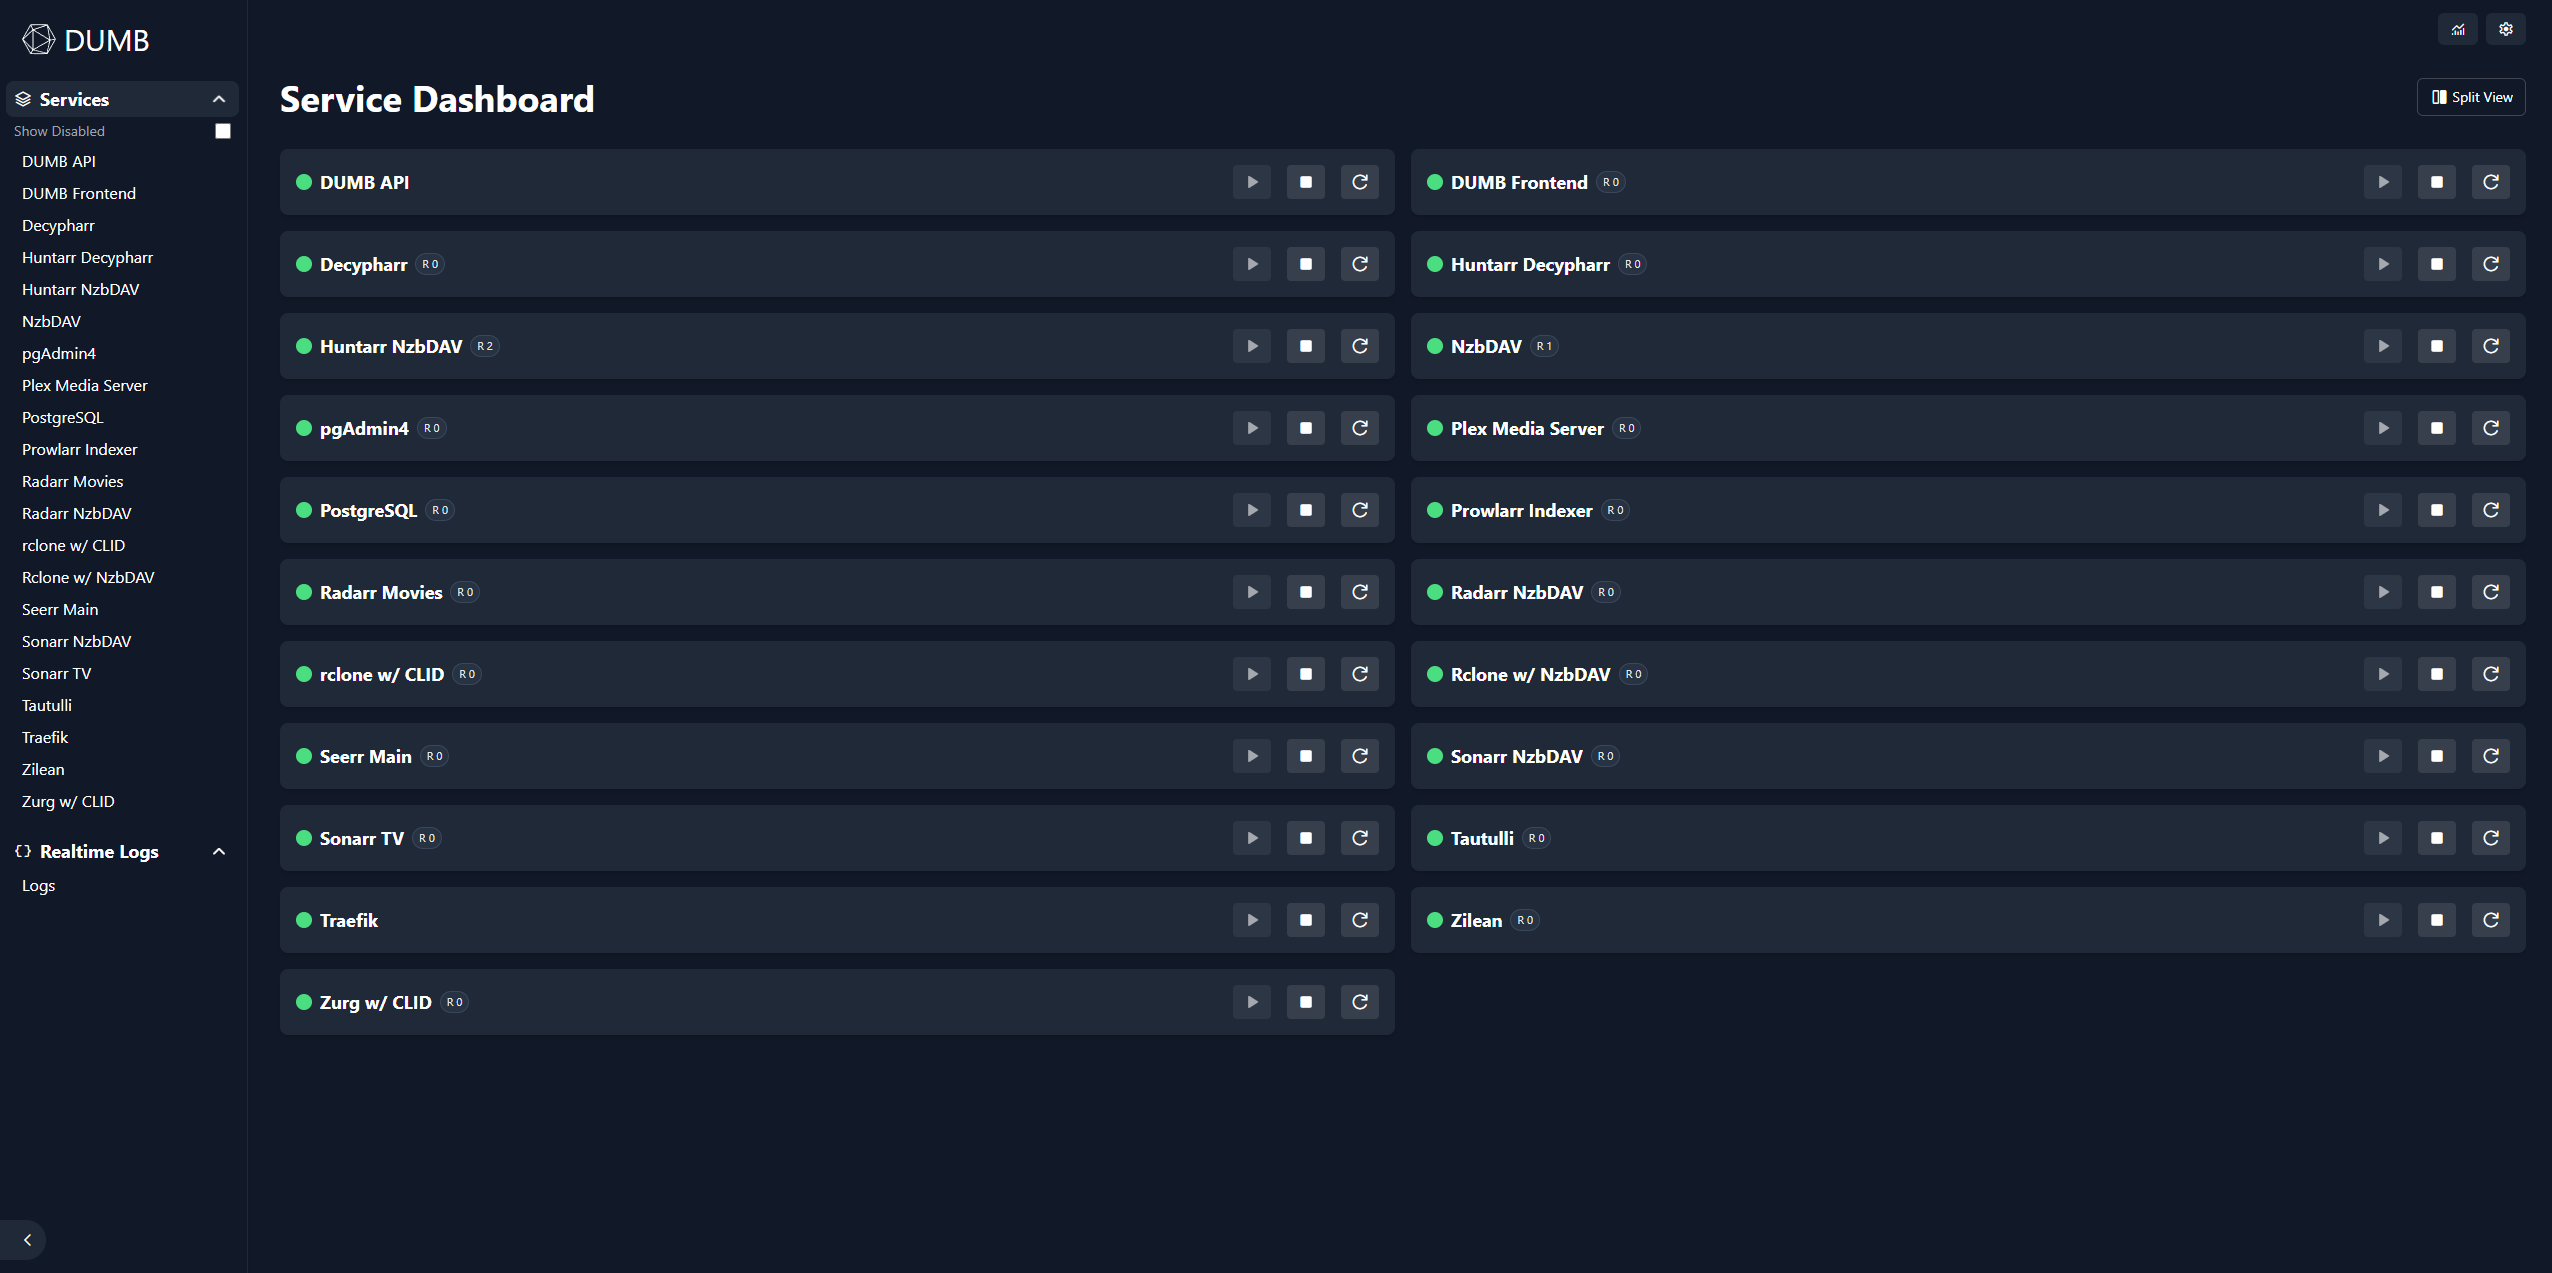
The dashboard displays service cards for each configured service, showing:
- Service name and status
- Health indicator
- Auto-restart badge
- Quick action and available-update buttons
Service cards#
Each service is represented by a card with the following elements:
Status indicator#
| Color | Status |
|---|---|
| Green | Running and healthy |
| Amber | Running but degraded |
| Blue | Application is starting or migrating |
| Rose | Running but application health is unhealthy |
| Red | Stopped |
| Gray | Unknown status |
Health badge#
When a service has health checks enabled, you'll see:
- Healthy - Service is responding correctly
- Degraded - Application is reachable but reports a warning
- Starting - Application is initializing or migrating
- Unhealthy - Application failed a restart-relevant health check
Hover the indicator or health badge to see the probe, reason, and component states supplied by the backend. The sidebar's Unhealthy filter includes only restart-relevant unhealthy states, not degraded or starting services.
Auto-restart badge#
If auto-restart is enabled for a service:
- Shows restart count (e.g., "Restarts: 2")
- Indicates the auto-restart feature is active
Resource badges (Geek Mode)#
With Geek Mode enabled, each service card shows live resource badges:
- CPU% - Color-coded by usage (green < 50%, amber < 80%, red >= 80%)
- Memory RSS - Current resident memory usage
- DB Healthy/Moderate/High/Critical + score - Current Database Health pressure for services explicitly opted into monitoring, color-coded by severity; hover for provider, mode, score, and recommendation
Metrics are polled every 5 seconds while Geek Mode is active and stop automatically when disabled. Database Health badges are omitted for unsupported services and services whose Database Health monitoring is disabled. Geek Mode never enables collection automatically.
Quick actions#
Each service card provides action buttons:
| Button | Action | Description |
|---|---|---|
| Start | Start a stopped service | |
| Stop | Stop a running service | |
| Restart | Restart a running service | |
| Update | Install the version already reported as available |
The per-service Update button appears only after DUMB has recorded an ordinary available update. It restarts that service as part of the install. Saved release, branch, commit, and pinned-version choices are never overridden by this shortcut.
Tooltips
Hover over action buttons to see what each will do.
Check and update multiple services#
Use Updates in the dashboard header to review every enabled service that supports DUMB-managed updates.
The button shows a pending count when cached checks report available updates.
This includes checks run manually and services configured with scheduled
Show on dashboard (auto_update_mode: check_only). The dashboard refreshes
the inventory periodically while open, so a completed background check can
light the badge without reloading the page.
- Select Check all to check the services sequentially.
- Review current and available versions plus any updater message.
- Select some updates, or use Select available.
- Select Install selected and confirm the restart warning.
Checks and installs run one service at a time. The panel shows the active service and retains a result on each row. You can close the panel without cancelling the operation: the dashboard shows a background-progress banner, and reopening Updates reattaches to the same progress and row states.
After an install finishes, newer DUMB backends show two measurements on the service row:
- Install is the complete update operation, including download/cache restore, build, activation, readiness checks, stabilization, and rollback when required.
- Downtime starts immediately before DUMB stops the old managed process and ends when the replacement first passes its application-readiness probe. The stabilization window after that first ready response remains part of Install, not Downtime. If no running process was stopped, the row says downtime was not observed. A failed update that never regains verified readiness reports a minimum measured downtime and says readiness was not confirmed.
These values use DUMB's monotonic server clock and bounded readiness polling, so
they measure the managed service interruption rather than browser request time.
The display is gated by the update_timing_metrics backend capability; older
backends continue to show normal update results without the timing row.
Only rows in the normal Update available state can be bulk-selected. A row marked Review source has a saved release, branch, commit, or version choice; open that service page to decide whether to install its configured target or use the explicit Override + latest action. The bulk workflow never overrides it.
Checking never restarts a service. Installing does. DUMB Frontend and DUMB API updates are ordered last so the loaded dashboard can report as much progress as possible.
For a DUMB Frontend update, the backend downloads, builds, and validates an adjacent replacement while the current dashboard continues serving requests. It stops the old frontend only for the final atomic swap, restart, and readiness check. The loaded dashboard treats that brief proxy disconnect as expected, reconnects to the backend's retained update status, and reloads itself after the replacement is ready. A failed candidate build leaves the current frontend running; a failed activation restores the previous runtime. DUMB API updates can still interrupt the final inventory refresh because the API is the update control plane itself. After a bulk update, verify service health and logs before continuing normal operation.
Service detail navigation#
Click anywhere on a service card (except the action buttons) to open its service page. For a full breakdown of service-page controls (config editors, logs, auto-restart overrides, and embedded UIs), see Service pages.
Real-time updates#
The dashboard automatically receives updates via WebSocket:
- Status changes appear immediately
- Health check results update in real-time
- No manual refresh needed
The connection status is shown in the header area. If disconnected, the frontend will automatically attempt to reconnect.
Toolbar and log viewer#
The toolbar and sidebar provide quick access to service settings and logs.

From here you can:
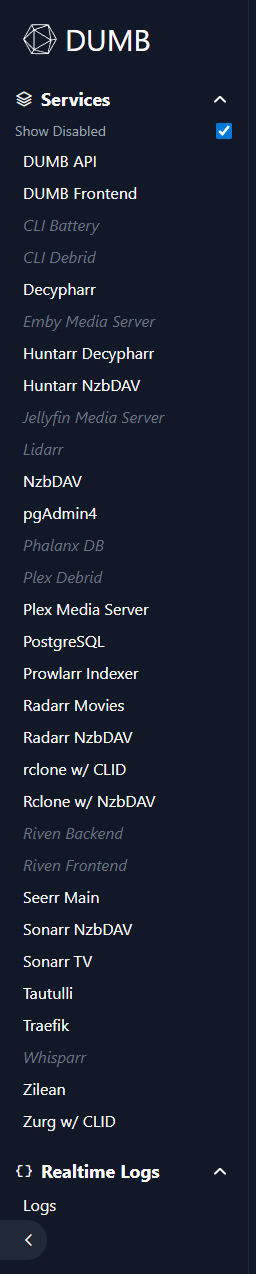
- Show disabled services
- Jump to a service’s logs or config
- Open the main DUMB config editor
Real-time logs#
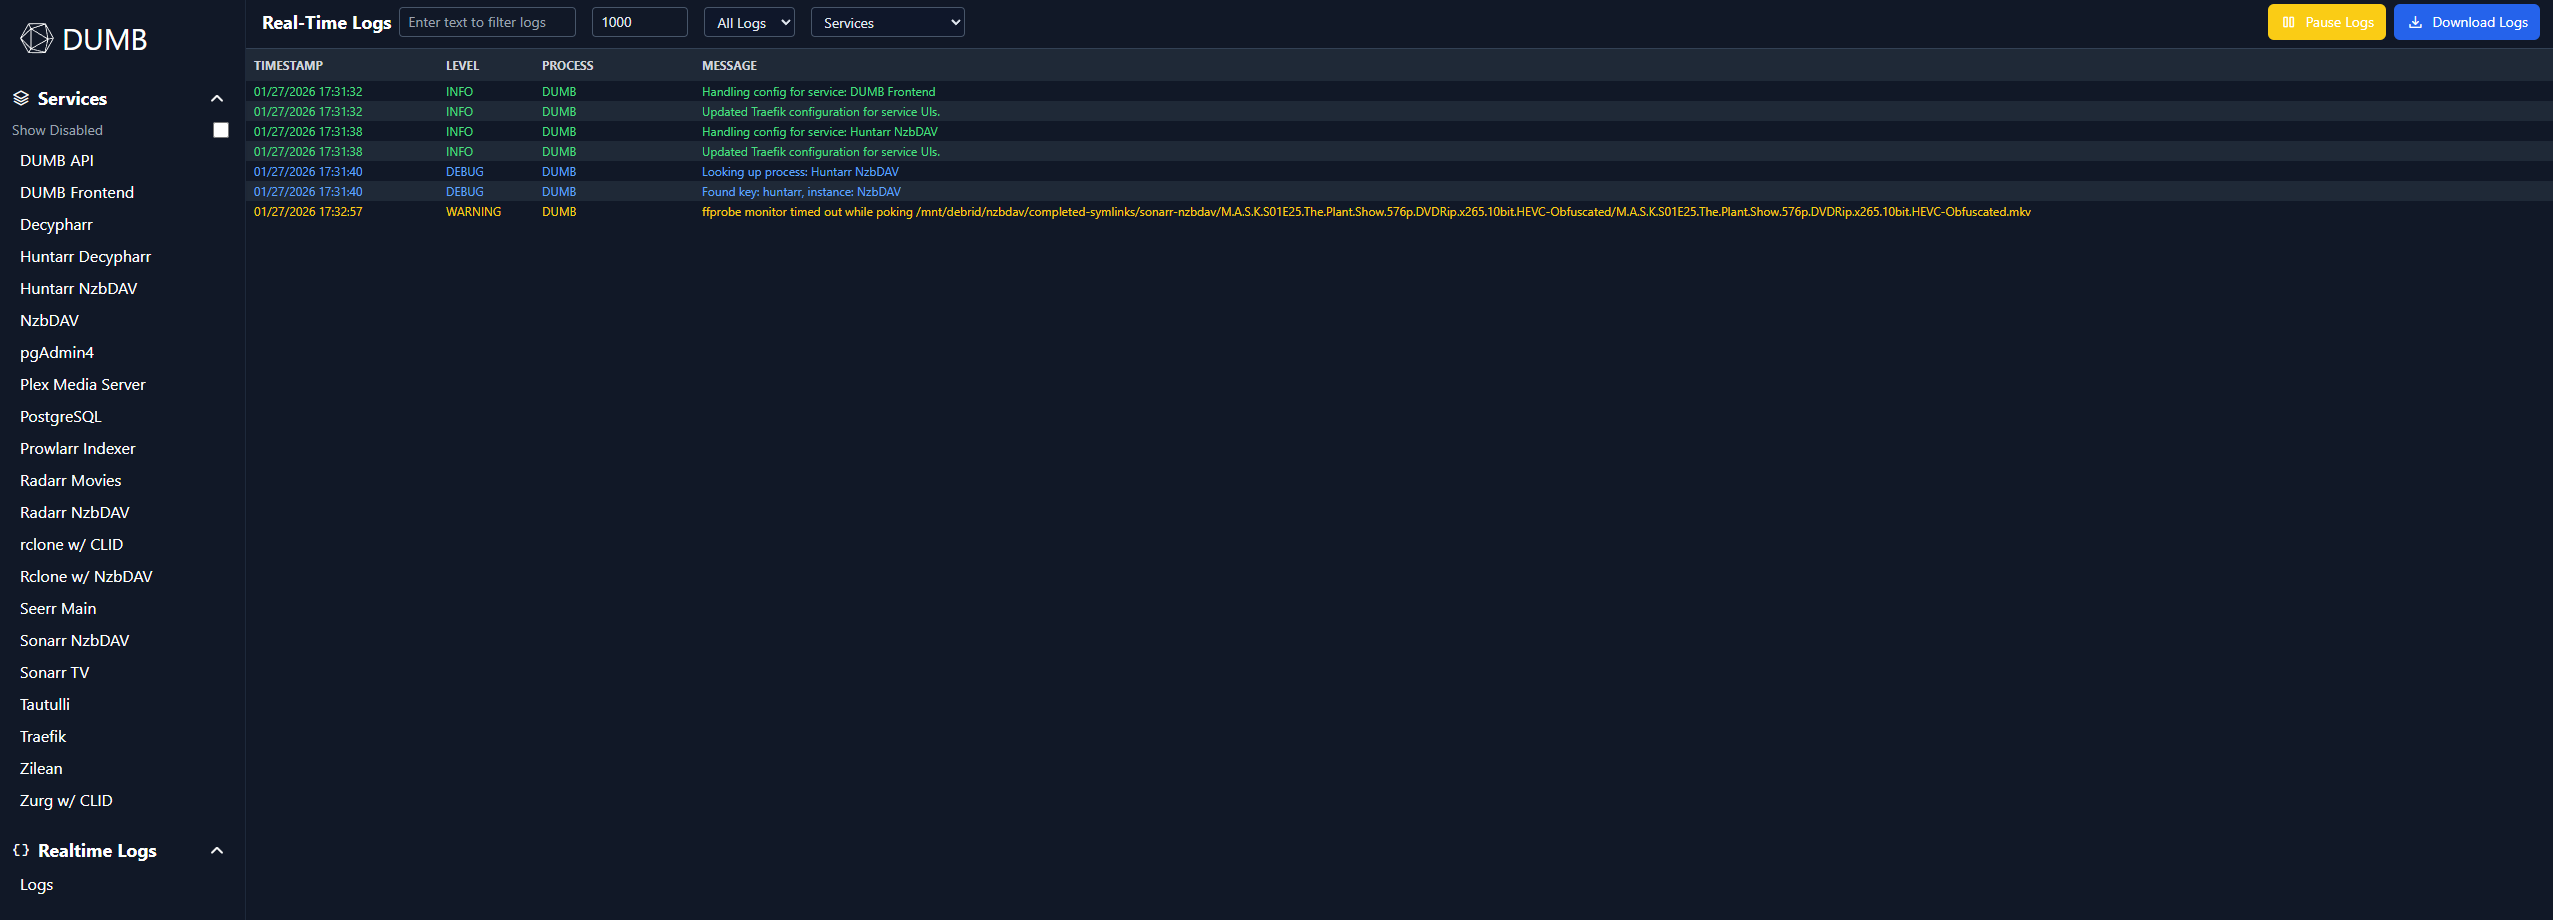
The log viewer supports:
- Filtering by text or log level
- Selecting process names
- Pausing/resuming the stream
- Downloading log snapshots (
DMB_logs.txt)
Filtering and organization#
Enabled services are displayed in a grid layout, organized by:
- DUMB services first - The API/frontend lead the default list
- Alphabetical order - Other services follow by name until you save a custom order
Tile reordering#
You can reorder dashboard service tiles with drag-and-drop.
- Drag a tile (or use the drag handle) to move it
- Other tiles shift in real time while you drag
- The same order is applied to the Services list in the sidebar
Order is persisted in dumb_config.json under:
dumb.ui.sidebar.service_order
Mobile and touch behavior#
On mobile, touch reordering is protected by a lock toggle to prevent accidental tile moves while scrolling:
- Reorder Off (default): touch scrolling only, no tile movement
- Reorder On: drag-handle touch reordering is enabled
System alerts#
When system resources are critically high, alerts appear at the top of the dashboard:
| Alert | Trigger |
|---|---|
| CPU Warning | CPU usage exceeds threshold (default 85%) |
| Memory Warning | Memory usage exceeds threshold (default 85%) |
| Disk Warning | Disk usage exceeds threshold (default 90%) |
Configure alert thresholds in the Settings page.
Sidebar navigation#
The sidebar provides quick access to:
- Home - Return to dashboard
- Settings - Configuration and preferences
- Metrics - System monitoring
- Onboarding - Re-run setup wizard
The Services section follows the same persisted service_order used by dashboard tiles.
Related pages#
- Service Management - Detailed service controls
- Metrics - System resource monitoring
- Settings - Dashboard preferences