Metrics Collection#
DUMB includes a comprehensive metrics collection system that monitors system resources and provides both real-time updates and historical data for analysis.
Overview#
The metrics system provides:
- Real-time monitoring - Live CPU, memory, disk, and network stats
- Historical tracking - Time-series data storage for trend analysis
- Per-process metrics - Resource usage by individual service
- Optional database health - Per-service SQL and persistent-store pressure indicators
- Optional Plex cloud status - Cached public Plex service health, incidents, and maintenance
- WebSocket streaming - Push updates to connected clients
- cgroup awareness - Accurate reporting in containerized environments
Collected metrics#
System metrics#
| Category | Metrics |
|---|---|
| CPU | Usage %, core count, load averages (⅕/15 min) |
| Memory | Total, used, available, percentage |
| Swap | Total, used, percentage |
| Filesystems | Total, used, free, percentage for each selected container-visible path |
| Inodes | Total, used, free, percentage for each selected filesystem |
| Network | Bytes/packets, errors, drops, link state, speed, and MTU for selected visible interfaces |
| System | Boot time, uptime |
Per-process metrics#
| Metric | Description |
|---|---|
| PID | Process identifier |
| CPU % | Process CPU utilization |
| Memory % | Process memory utilization |
| Memory RSS | Resident set size in bytes |
Configuration#
Metrics are configured in dumb_config.json:
"dumb": {
  "metrics": {
    "system_scope": "auto",
    "filesystem_paths": [
      "/data",
      "/config"
    ],
    "network_interfaces": [
      "all"
    ],
    "history_enabled": true,
    "history_interval_sec": 5,
    "history_retention_days": 7,
    "history_max_file_mb": 50,
    "history_max_total_mb": 100,
    "history_dir": "/config/metrics",
    "storage": {
      "provider": "sqlite",
      "sqlite_path": "/config/metrics/metrics.sqlite",
      "migrate_jsonl": true,
      "postgresql": {
        "database": "dumb_metrics",
        "schema": "public",
        "local_retention_days": 7,
        "retry_interval_sec": 60
      }
    },
    "database_health": {
      "enabled": false,
      "interval_sec": 60,
      "log_tail_bytes": 262144,
      "services": {
        "infinidysk": {
          "enabled": true,
          "mode": "standard",
          "ignore_network_storage": false
        },
        "sonarr:Default": {
          "enabled": true,
          "mode": "enhanced"
        }
      }
    },
    "plex_status": {
      "enabled": false,
      "interval_sec": 300
    }
  }
}
Configuration options#
| Option | Default | Description |
|---|---|---|
system_scope |
auto |
Choose system scope for metrics (auto, host, container) |
filesystem_paths |
["/"] |
Absolute paths visible inside the container whose filesystems are monitored; the first path is primary for compatibility fields and the existing disk/inode history charts |
network_interfaces |
["all"] |
Interface names visible in DUMB's network namespace; all preserves the aggregate of every visible interface, including loopback |
history_enabled |
true |
Store historical data |
history_interval_sec |
5 |
Seconds between samples |
history_retention_days |
7 |
Days to keep history |
history_max_file_mb |
50 |
Legacy JSONL rotation limit retained for compatibility with older DUMB releases |
history_max_total_mb |
100 |
Maximum compressed payload size retained in local SQLite |
history_dir |
/config/metrics |
Legacy JSONL source directory used during migration |
storage.provider |
sqlite |
Primary history backend: sqlite or postgresql |
storage.sqlite_path |
/config/metrics/metrics.sqlite |
Dedicated local metrics database; also the PostgreSQL continuity store |
storage.migrate_jsonl |
true |
Import existing rotating JSONL history once without deleting source files |
storage.postgresql.database |
dumb_metrics |
Dedicated DUMB-managed PostgreSQL database |
storage.postgresql.schema |
public |
PostgreSQL schema used for metrics tables |
storage.postgresql.local_retention_days |
7 |
Local history retained for outage fallback and replay |
storage.postgresql.retry_interval_sec |
60 |
Minimum PostgreSQL retry interval after a failure |
database_health.enabled |
false |
Enable the database-health collector; individual services must still opt in |
database_health.interval_sec |
60 |
Seconds between database collections (15-3600) |
database_health.log_tail_bytes |
262144 |
Maximum new/recent service-log bytes examined per collection |
database_health.services |
{} |
Per-service/instance settings keyed by the ID reported in /api/metrics |
plex_status.enabled |
false |
Poll and cache Plex's public cloud-service status |
plex_status.interval_sec |
300 |
Minimum seconds between Plex status feed requests (60-3600) |
Plex Cloud Status#
Plex Cloud Status is disabled by default. Enable it from Metrics → Settings → Plex Cloud Status or from the Plex service page's Plex Status panel. DUMB then polls the fixed public summary feed behind status.plex.tv from the backend, caches the normalized result, and includes it in live metrics snapshots.
The local view reports:
- Plex's overall cloud-service indicator and description;
- counts of reported components and any components that are not operational;
- active incident names, impact, status, and official incident links;
- scheduled maintenance;
- collection time, response time, and whether a failed refresh is showing a stale last-known-good sample.
No Plex token, local service configuration, hostname, library information, or usage data is sent with this request. The metric describes Plex-operated services such as authentication, hosted apps, metadata, messaging, and remote-access infrastructure. It does not test the local Plex Media Server process, the DUMB host, LAN clients, port forwarding, DNS, or the complete playback path. Use the normal service status, logs, and local/network diagnostics for those checks.
When the status feed cannot be refreshed, DUMB retains the last successful sample and marks it stale. If no successful sample exists, it reports the feed as unavailable without exposing the raw network exception.
Database Health Monitoring#
Database Health Monitoring is disabled by default and enabled independently for each service. It recognizes every DUMB-managed service with a confirmed database or application-owned persistent store:
| Provider class | Services and observed stores |
|---|---|
| SQLite | CLI Debrid, CLI Battery, Emby, Jellyfin, Maintainerr, Profilarr, Tautulli, and Plex; Sonarr, Radarr, Lidarr, Prowlarr, and Whisparr when PostgreSQL is disabled |
| SQLite or PostgreSQL | AIOStreams, AltMount, Bazarr, InfiniDysk, Pulsarr, and Seerr; DUMB detects the provider from their application config/environment |
| PostgreSQL | DUMB PostgreSQL, pgAdmin, mediastorm, Riven Backend, Zilean, and Traefik Proxy Admin; Arr instances when postgres_enabled=true |
| Custom persistent stores | Decypharr append-only logs, Phalanx DB Hyperbee/Corestore data, and the Zurg state directory |
For InfiniDysk, SQLite or PostgreSQL describes only its main operational
database. metrics.sqlite, warden.db, and usenet-migration.db remain
auxiliary SQLite stores after a PostgreSQL cutover, so their local filesystem
health and backup requirements do not disappear when the main provider changes.
Services without a confirmed database or durable application store are not listed merely because they use files or caches. Multi-instance services receive one Database Health entry per enabled instance.
AIOStreams uses SQLite by default and switches provider detection when its advanced top-level aiostreams.database_uri setting uses a PostgreSQL URI. Database Health observes the active provider but does not migrate data between SQLite and PostgreSQL; plan and validate that change separately with an independent backup.
Two modes are available:
| Mode | Continuous observations |
|---|---|
| Standard | Database/store/WAL/SHM size, filesystem type and placement, byte capacity/free space, inode usage/free inodes, read-only state, and service-log lock/busy/timeout/I/O signals |
| Enhanced | Standard signals plus bounded, read-only SQLite metadata or PostgreSQL statistics queries when the detected provider supports them |
Each service can set ignore_network_storage: true when its storage placement is intentional. DUMB continues to report the detected filesystem, but excludes that network mount from the service's pressure score and recommendation. Other evidence—including WAL growth, lock/busy/timeout errors, probe latency, deadlocks, and long transactions—continues to affect the result.
Filesystem capacity and inode observations are grouped by mount, so a service with multiple databases on one filesystem is not penalized repeatedly. DUMB also reports local DUMB-managed PostgreSQL storage; an external PostgreSQL host's filesystem cannot be observed from inside DUMB. The network-storage override affects only the network-placement penalty—low free space, inode exhaustion, and read-only state remain active indicators.
Automatic collection never runs VACUUM, ANALYZE, a WAL checkpoint, an integrity check, a repair, a migration, or an application data query. Plex remains passive even if Enhanced is selected because Plex uses a customized SQLite build and its live library database is treated conservatively. Decypharr, Phalanx DB, and Zurg also remain passive because their observed stores are not confirmed SQL databases. Directory-backed custom stores use a bounded size/file-count scan rather than opening application data.
What Zurg's database means here
The public Zurg build used by DUMB calls its in-memory torrent catalog a database, but it does not expose that catalog as SQLite or PostgreSQL. DUMB labels Zurg as zurg-state and passively samples the instance's data/ directory, which includes fixers.json in the public build and can contain other version-specific state. It cannot query the live in-memory torrent catalog or infer torrent-catalog performance from those files.
Interpret the result as evidence, not a benchmark
DUMB observes databases from outside the managed application. It cannot profile individual application queries, prove root cause, predict a PostgreSQL percentage improvement, guarantee that short-lived events were captured, repair a database, replace backups, or replace application-native diagnostics. A healthy result means DUMB observed no configured external pressure indicators during the collection window; it is not an integrity guarantee.
The pressure score considers recent database-related log errors, network-filesystem placement unless explicitly ignored, filesystem fullness, inode pressure, read-only mounts, WAL growth, read-only probe latency, PostgreSQL lock waiters/deadlocks, and long-running transactions. Filesystem fullness begins contributing at 90%, inode usage begins contributing at 90%, and increasingly severe thresholds contribute more evidence. If SQLite is on NFS/SMB or another network filesystem, local storage is normally preferred; use the per-service override only when you intentionally want to assess the remaining signals independently.
Pressure classifications use these score bands:
| Classification | Score | Meaning |
|---|---|---|
| Healthy | 0-19 | No configured pressure indicator, or only low-weight evidence, was observed |
| Moderate | 20-44 | Evidence deserves continued observation and workload correlation |
| High | 45-69 | Strong evidence warrants investigation |
| Critical | 70-100 | Multiple or severe indicators require prompt investigation |
observing, collecting, unavailable, and disabled describe collection state rather than a scored pressure band.
Compact database-health samples are included in normal metrics history without storing database paths or storage-source details.
Real-time streaming#
Metrics are streamed via WebSocket at /ws/metrics:
const ws = new WebSocket('ws://localhost:3005/ws/metrics?interval=2');

ws.onmessage = (event) => {
  const data = JSON.parse(event.data);
  if (data.type === 'snapshot') {
    updateDashboard(data.data);
  }
};
Query parameters#
| Parameter | Default | Description |
|---|---|---|
interval |
2 |
Update frequency (0.5-10 seconds) |
history |
false |
Include historical data on connect |
bootstrap |
true |
Send initial snapshot immediately |
token |
- | JWT token (if auth enabled) |
Historical data#
Metrics history storage#
DUMB stores each complete snapshot as a timestamp-indexed, compressed payload. Metrics history is independent from the notification delivery database.
| Backend | Behavior |
|---|---|
| SQLite (default) | Writes /config/metrics/metrics.sqlite. It is self-contained, survives container recreation through /config, and requires no managed service. |
| PostgreSQL (optional) | Uses the configured DUMB PostgreSQL credentials and a dedicated dumb_metrics database by default. Applying the selection enables, provisions, and starts DUMB-managed PostgreSQL in place. |
PostgreSQL is not a secondary backup in this design. When configured and healthy, it is the active history query and retention backend. DUMB first commits each sample to a bounded local SQLite continuity buffer, then copies missing samples to PostgreSQL in timestamp order. This write-ahead step prevents a PostgreSQL restart or outage from creating a gap. If PostgreSQL is stopped, starting, upgrading, or unreachable, history reads and writes continue through SQLite. After connectivity returns, DUMB performs an idempotent reconciliation of the retained SQLite window—including samples older than PostgreSQL's newest row—before PostgreSQL resumes serving history reads.
Selecting PostgreSQL from Metrics → Settings does not require a DUMB restart on backends that advertise metrics_history_hot_activation. Apply saves the Metrics configuration, enables PostgreSQL when no other service uses it, registers and creates the configured Metrics database, starts or reuses the managed PostgreSQL process, replays retained SQLite samples, and promotes PostgreSQL only after synchronization succeeds. The operation is idempotent, so Apply can safely retry a failed activation. If provisioning or synchronization fails, the API and frontend remain available and SQLite continues serving history.
Older DUMB backends without that capability retain the previous restart-based provisioning behavior; dmbdb identifies this case in the panel instead of attempting the unsupported endpoint.
Notifications do not depend on PostgreSQL
Notification delivery uses /config/notifications/notifications.sqlite. A PostgreSQL metrics outage therefore cannot prevent DUMB from queuing a PostgreSQL failure notification.
Existing JSONL history#
Earlier DUMB releases wrote rotating metrics-YYYYMMDD-NNN.jsonl files under /config/metrics. On first use of the database-backed history store, DUMB imports those files idempotently into SQLite. It records completion only after every line decodes and every batch writes successfully, and it leaves every JSONL file untouched for rollback. If a record is malformed or a batch fails, Metrics reports the imported and skipped counts, preserves the incomplete state, and retries on a later manual import or DUMB startup. Use Metrics → Settings → Import JSONL now to force a fresh rescan without duplicating timestamps, including after temporarily running an older DUMB release that created additional JSONL files. In PostgreSQL mode, a rescan temporarily returns history reads to SQLite and fully reconciles the retained window before PostgreSQL is promoted again, so an older imported sample is not skipped merely because PostgreSQL already contains newer rows.
The configured history_max_file_mb remains in the schema so the same runtime configuration can still be read by older releases, but database-backed DUMB no longer creates new JSONL files.
Storage size and compression#
Database storage normally uses less space than the equivalent JSONL snapshots because DUMB compresses each repeated-key JSON payload before writing it. The Metrics settings panel reports raw JSON bytes, compressed payload bytes, database file/relation size, and the observed compression ratio.
The filesystem database size will not exactly equal compressed payload size:
- SQLite includes pages, indexes, free pages, and
-wal/-shmfiles. - PostgreSQL includes row, page, index, visibility, and WAL overhead.
- Recently deleted rows/pages may remain allocated for reuse.
For that reason, SQLite usually provides the clearest space reduction for a single DUMB container. PostgreSQL is primarily useful for longer retention, external queries, stronger concurrency, and centralized operations—not as a guaranteed compression improvement over SQLite.
Data structure#
Each history entry contains:
{
  "timestamp": "2025-01-15T10:30:00Z",
  "cpu": {
    "percent": 45.2,
    "count": 8,
    "load_avg": [1.5, 1.2, 0.9]
  },
  "memory": {
    "total": 17179869184,
    "available": 8589934592,
    "percent": 50.0
  },
  "disk": {
    "total": 500107862016,
    "used": 250053931008,
    "percent": 50.0
  },
  "network": {
    "bytes_sent": 1073741824,
    "bytes_recv": 2147483648
  }
}
Querying history#
Retrieve historical data via API:
# Get history newer than a Unix timestamp
curl "http://localhost:3005/api/metrics/history?since=1784300000&limit=5000"

# Get compact chart series with server-side buckets
curl "http://localhost:3005/api/metrics/history_series?since=1784300000&bucket_seconds=300&max_points=600"

# Inspect configured/active storage and compression
curl "http://localhost:3005/api/metrics/history/storage?probe_postgresql=true"
cgroup awareness#
DUMB automatically detects containerized environments and reports appropriate metrics:
Container mode#
When running in Docker/Kubernetes with resource limits:
- CPU - Reports usage relative to container limit
- Memory - Reports container memory limit, not host
- Disk - Reports every path selected in
filesystem_paths - Inodes - Reports inode capacity and pressure for every selected path
- Network - Reports only interfaces in the container network namespace unless the container uses host networking
Host mode#
When running without cgroup limits:
- Reports full host system resources
Detection
cgroup detection is automatic. DUMB checks for cgroup v1 and v2 interfaces.
Selecting the correct storage#
Docker only exposes paths mounted into the container. DUMB cannot infer or inspect the host-side source path for storage that is not mounted. Open Metrics → Settings → Monitored Filesystems, then select a discovered container mount such as /data, /config, or another bind-mounted path. You can also enter an absolute container path manually.
The first selected path is the primary filesystem. DUMB keeps its values in the legacy system.disk and system.inode fields and uses it for the existing disk/inode historical charts. Every selected path is returned in system.filesystems, retained in raw/compact history, evaluated by browser alerts, and evaluated independently by backend notification thresholds. Reordering paths changes which filesystem is primary; it does not change Docker mounts.
If two selected paths map to the same underlying host filesystem, their capacity values can be identical. A missing or inaccessible configured path remains visible as unavailable instead of silently falling back to /.
Selecting network interfaces#
Open Metrics → Settings → Monitored Network Interfaces to choose all or specific interface names discovered inside DUMB's network namespace. With normal Docker bridge networking, the useful interface is commonly eth0; selecting it excludes loopback traffic from the aggregate chart. With network_mode: host, DUMB can discover and select the host's interfaces instead.
The compatibility system.net_io object is the sum of the selected available interfaces. system.network_interfaces reports each selected interface separately with cumulative byte/packet/error/drop counters plus link state, speed, and MTU. Compact history and chart-series responses retain per-interface rates. A configured interface that temporarily disappears remains visible as unavailable rather than being replaced by another interface.
system_scope does not cross network namespaces. Selecting host or cgroup changes CPU/memory collection behavior, but it cannot expose host network interfaces to a bridge-networked container.
API endpoints#
Current metrics#
GET /api/metrics
Returns the current metrics snapshot.
Database health#
GET /api/metrics/database-health
GET /api/metrics/database-health?process_name=InfiniDysk&refresh=true
The optional process_name filter returns one service. refresh=true invalidates cached database probes before collecting; normal /api/metrics and WebSocket snapshots reuse the configured slower database interval.
Historical metrics#
GET /api/metrics/history
GET /api/metrics/history_series
GET /api/metrics/history/storage
POST /api/metrics/history/migrate
Query parameters:
| Parameter | Description |
|---|---|
since |
Earliest Unix timestamp to return |
full |
Skip the default six-hour lower bound when true |
limit |
Maximum snapshots read before truncation |
bucket_seconds |
Aggregation bucket size for history_series |
max_points |
Maximum chart points returned by history_series |
GET /api/metrics/history/storage reports the configured and active providers, fallback state, compression/storage sizes, sample ranges, last PostgreSQL error, and legacy migration state. Pass probe_postgresql=true to bypass the reconnect backoff for an operator-requested test. POST /api/metrics/history/migrate reruns the idempotent JSONL import; pass force=true to rescan after a completed migration.
Frontend integration#
Metrics page#
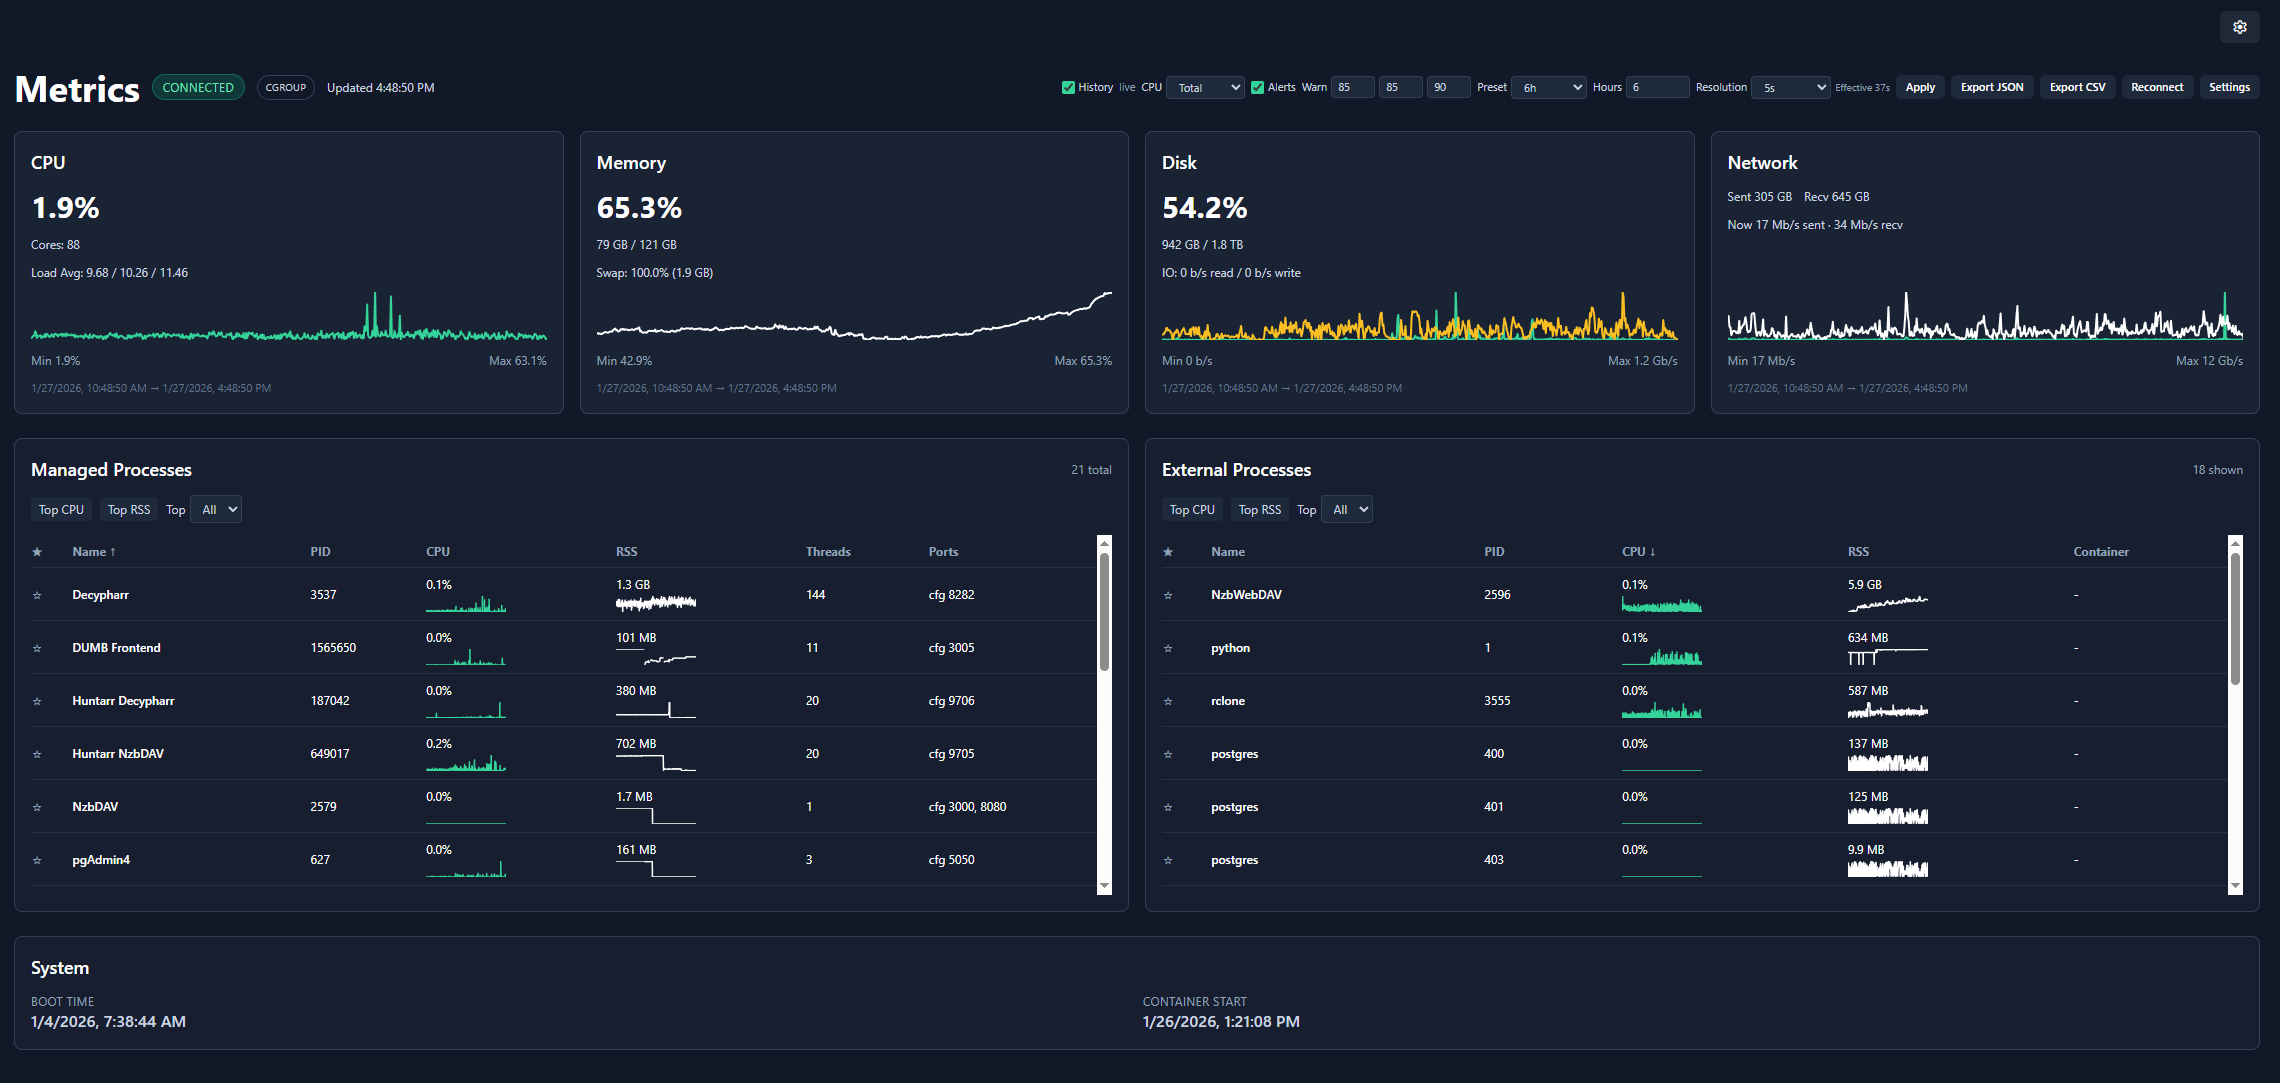
The frontend Metrics page displays:
- Real-time gauges for CPU, memory, disk, and inode pressure
- Historical line charts, including inode usage
- Per-process resource table
- System information panel
- Database Health immediately above System, with expandable per-service details
Dashboard alerts#
Configure thresholds in Settings to show alerts:
| Resource | Default Threshold |
|---|---|
| CPU | 85% |
| Memory | 85% |
| Disk | 90% |
| Inodes | 90% |
| Database Health | Disabled by default; optional Moderate, High, or Critical minimum |
Alerts appear as banners when thresholds are exceeded. Database Health alert inclusion and its minimum pressure level are browser-local preferences, matching the existing CPU, memory, disk, and inode alert controls; they do not change collection or scoring.
Backend outbound notifications have independent persistent thresholds for CPU, memory, disk, inode, and Database Health conditions. See Notifications. Enabling a backend notification threshold does not alter browser-local alert preferences.
Data retention#
Automatic cleanup#
Old metrics samples are automatically removed based on:
history_retention_days- Primary-backend samples older than this are deletedhistory_max_total_mb- Oldest local SQLite payloads are deleted when exceededstorage.postgresql.local_retention_days- SQLite fallback/replay window while PostgreSQL is primary
Retention and size maintenance runs periodically rather than for every sample, so a database can temporarily exceed a newly selected limit until the next maintenance pass. Changing Metrics storage settings schedules maintenance for the next sample.
Manual cleanup#
Do not delete a live database while DUMB is writing it. Stop DUMB first, then back up or remove the relevant database if a full reset is intentional. The old JSONL files can be removed after you have validated the imported sample range and retained any rollback copy you need:
rm /config/metrics/metrics-*.jsonl
Performance considerations#
Collection overhead#
Metrics collection has minimal performance impact:
- CPU sampling uses
/proc/stat - Memory from
/proc/meminfo - Non-blocking I/O operations
Storage requirements#
Estimate storage needs:
| Interval | Daily Size (approx) |
|---|---|
| 5 seconds | ~5 MB |
| 10 seconds | ~2.5 MB |
| 30 seconds | ~800 KB |
Troubleshooting#
Metrics not updating#
- Check WebSocket connection status
- Verify
metrics.enabledistrue - Check for JavaScript errors in browser console
High storage usage#
- Reduce
history_retention_days - Increase
history_interval - Lower
history_max_total_mb - Compare compressed payload and database allocation in Metrics → Settings → History Storage
- If PostgreSQL is active, review its relation size and normal PostgreSQL maintenance behavior
Incorrect resource values#
- Verify cgroup detection is working
- Check container resource limits
- Restart DUMB to refresh detection
Related pages#
- Frontend Metrics - UI guide
- WebSocket API - Streaming protocol
- Dashboard - Alert display